0-18세 한국 소아청소년 성장차트 백분위수, Growth charts and growth percentiles of 0-18 year old Korean children and adolescents
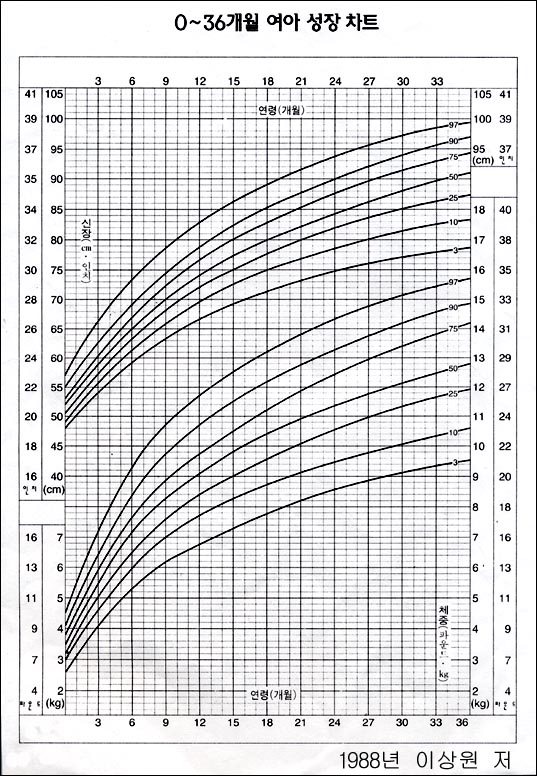
그림 5-1. 0-36개월 한국 여아 성장차트(대한소아과학회 1975년도 한국 남아 체중, 신장치를 근거로 1988년도 소아과 전문의 이상원 저)
Copyright ⓒ 2011 John Sangwon Lee, MD, FAAP
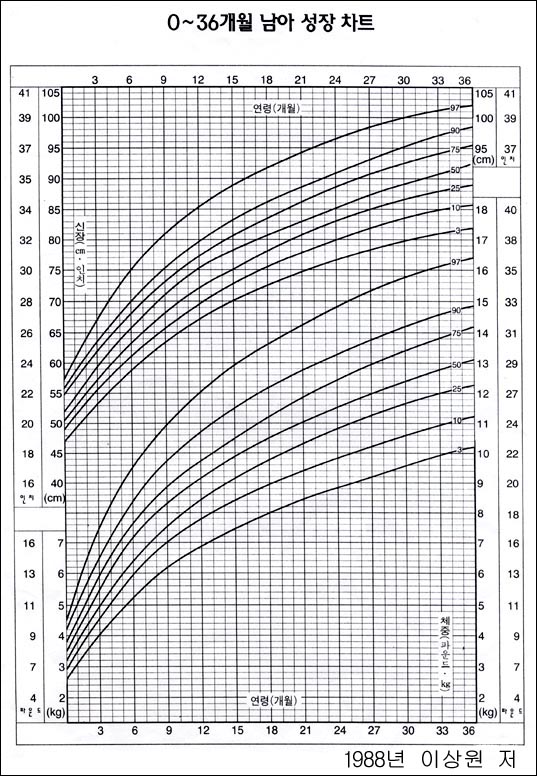
그림 5-3. 0-36개월 한국 남아 성장차트(대한소아과학회 1975년도 한국 남아 체중, 신장치를 근거로 1988년도 소아과 전문의 이상원 저)
Copyright ⓒ 2011 John Sangwon Lee, MD., FAAP
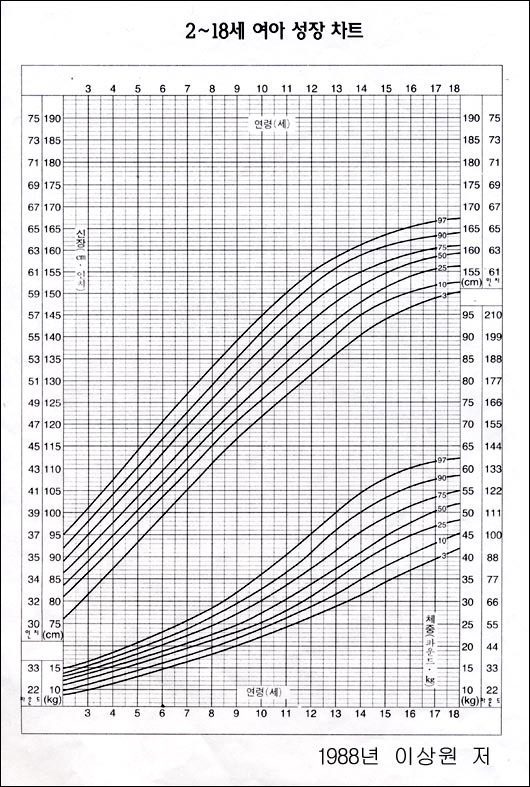
그림 5-2. 2-18세 한국 여아 성장차트(대한소아과학회 1975년도 한국 남아 체중, 신장치를 근거로 1988년도 소아과 전문의 이상원 저)
Copyright ⓒ 2011 John Sangwon Lee, MD., FAAP
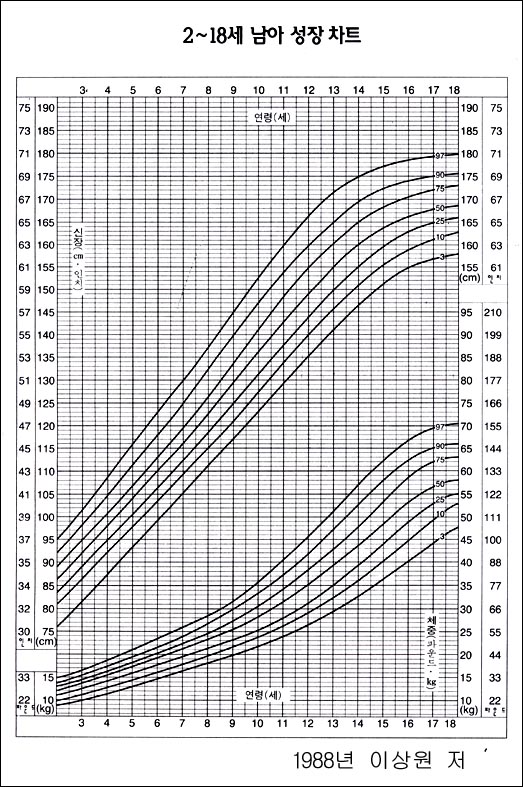
그림 5-4. 2-18세 한국 남아 성장차트(대한소아과학회 1975년도 한국 남아 체중, 신장치를 근거로 1988년도 소아과 전문의 이상원 저)
Copyright ⓒ 2011 John Sangwon Lee, MD., FAAP
- 건강한 소아청소년(0~18세)들의 체중 치와 신장 치에 해당되는 나이와 만나는 좌표 점을 이어서 만든 차트를 성장차트라고 한다.
소아청소년 성장차트의 종류
- 0~3세 남 신생아들, 영유아들의 체중 성장차트
- 2~18세 남 유아들, 학령기 아이들, 사춘기 아이들의 체중 성장차트
- 0~3세 남 유아들의 신장 성장차트와
- 2~18세 남 유아들, 학령기 아이들, 사춘기 아이들의 신장 성장차트
- 0~3세 여 신생아들, 영유아들의 체중 성장차트와
- 2~18세 여 유아들, 학령기 아이들, 사춘기 아이들의 체중 성자차트
- 0~3세 여 신새아들, 영유아들의 신장 성장차트와
- 2~18세 여 유아들, 학령기 아이들, 사춘기 아이들의 신장 성장차트
- 각 인종 또는 각 나라에 따라 만든 각국 소아청소년 성장차트
- 만삭 신생아로 태어난 만삭 신생아 성장차트와 미숙 신생아 성장차트
- ⑪ 두위 성장차트 등이 있다.
성장차트를 어떻게 만드나
- 소아청소년 체중 성장차트는 소아청소년의 나이(월령 또는 연령) X선과 그 나이에 해당되는 체중 치(단위는 kg 또는 파운드) Y선이 만나는 (XY) 좌표 점을 연결해서 만든 도표이다.
- 여러 종류(①~⑪)의 성장차트가 있다.
- 신장 성장차트는 아이의 나이(월령 또는 연령) X선과 나이에 해당되는 신장 치(단위는 cm 또는 인치) Y선이 만나는(XY) 좌표 점을 연결해서 만든다.
- 거의 마찬가지로, 체중 성장차트는 아이의 나이(월령 또는 연령) X선과 그 나이에 해당되는 체중 치(kg이나 파운드) Y선이 만나는 (XY) 좌표 점을 연결해서 만든다.
- 체중 치에 해당되는 X선이나 신장 치에 해당되는 X선과 그 아이의 연령에 해당되는 연령 Y이 만나는 (XY)점을 성장차트에서 찾아, 각 아이의 성장차트 체중 백분위선에 있는 퍼센타일이 얼마인지 알아보고 또 신장 백분위선에 있는 신장 퍼센타일이 얼마인지 알아볼 수 있다.
- 한 아이의 체중과 신장이 그 아이의 체중 백분위선이나 신장 백분위선을 따라 계속 정상적으로 자라는지 육안으로 직접 보고 타각적으로 평가할 수 있다.
- 성장차트는 소아청소년 남여 성별에 따라, 나이에 따라 생후 0~36개월 영유아 성장차트와 생후 2~18세 유아, 학령기 아이, 사춘기 아이 성장차트가 따로 있다.
- 나이와 성별에 따라 해당 성장차트를 이용해야 한다.
- 다시 설명하면, 소아청소년 나이, 즉 월령, 또는 연령 (X)에 해당되는 체중 치(Y)가 서로 만나는 (XY) 좌표 점을 이어 만든 체중 성장차트와 소아청소년 나이 즉 월령 또는 연령(X)에 해당되는 신장 치가 서로 만나는 (XY) 좌표 점을 이어 만든 신장 성장차트가 따로 있다.
- 성장차트 맨 위 최상 횡선과 맨 아래 바닥 횡선에 있는 숫자는 월령 또는 연령이고, 맨 왼쪽 수직선 숫자와 맨 오른쪽 수직선 숫자는 체중 치 또는 신장 치이다.
- 체중 치 단위는 킬로그램(kg) 또는 파운드(lb)이고 신장 치 단위는 센티미터(cm) 또는 인치(in)이다.
- 성장차트 백분위선 맨 오른쪽에 있는 3, 10, 25, 50, 75, 90, 97의 숫자는 체중 백분위 수치(체중 퍼센타일)나 신장 백분위 수치(신장 퍼센타일)이다.
- 소아청소년들의 신장과 체중은 인종·나라·지방·사회·환경·식생활 등에 따라 다르다.
- 각 아이에 따라 성장차트 체중 백분위선과 신장 백분위선이 다르다.
- 태어나서 2~3세까지 신생아, 영유아 성장 속도는 2~3세부터 18세까지 유아, 학령기 아이, 사춘기 아이의 성장 속도에 비해 다른 점이 많다.
- 0~3세까지 체중 성장차트, 신장 성장차트와 2~18세까지 체중 성장차트, 신장 성장차트가 남녀아 별로 따로 있다.
- 소아청소년 여아 성장 발육과 소아청소년 남아 성장 발육이 많이 다르기 때문에 소아청소년 여아 성장차트와 소아청소년 남아 성장차트가 따로 있다.
- 0~3세 신생아 영유아들의 체중 성장차트와 신장 성장차트,
- 2~18세 유아, 학령기 아이, 사춘기 여아 체중 성장차트와 신장 성장차트,
- 0~3세 신생아, 영유아 체중 성장차트와 신장 성장차트,
- 2~18세 유아, 학령기 아이, 사춘기 남아 체중 성장차트와 신장 성장차트 등 총 여덟 가지의 기본 소아청소년 성장차트가 있다.
- 성장차트로 소아청소년의 체중과 신장의 성장 상태와 성장 패턴을 일목요연하게 쉽게 알아볼 수 있다.
- 여기에 있는 한국 남녀 소아청소년 성장차트는 1975년에 한국 소아과학회에서 수집한 한국 소아청소년 체중 치과 신장 치의 통계 자료를 이용해 저자가 만들어 1988년도 소아가정의학백과에 섰다.
- 자녀들의 나이에 해당되는 체중과 신장 퍼센타일과 성장 퍼센타일이 얼마인지 알면 자녀의 신장과 체중의 성장 속도를 알 수 있고, 나서부터 18세가 될 때까지 추정 체중 치과 신장 치를 얼마나 될 것인지 알아볼 수 있다.
성장차트를 이용하는 방법 How to use growth charts
- 소아청소년 신장 치와 소아청소년 체중 치를 정확히 재고, 체중 치와 신장 치를 성장차트해당 XY좌표에 그려 소아청소년 성장 상태를 타각적으로 알아볼 수 있다.
- 가능한 한 겉옷은 벗고 속옷이나 팬티와 가운을 입은 상태에서 체중과 신장을 잰다.
- 남아이면 남아 연령에 해당하는 성장차트를 선택하고, 연령이 3세 이하이면 0~3세 남아 성장차트를 선택하고,
- 아이의 연령에 해당되는 수직선(Y)과 신장 치나 체중 치에 해당하는 수평선(X)이 서로 만나는 신장 좌표 점(XY)와 체중 좌표 점(XY)을 찾는다.(참고로 최근에 수집한 한국소아청소년들의 체중과 신장을 기준으로 만든 성장차트와 여기 있는 성장차트를 비교할 때 한국 청소년들의 체중과 신장이 더 큰 것을 알 수 있다.)
- 각각 좌표 점(XY)에 해당되는 성장차트 백분위선이 각 아이의 신장 백분위선이나 체중 백분위선이 된다.
- 이렇게 찾은 각 아이의 신장 백분위 수치와 체중 백분위 수치를 비교해 보면 각 아이의 체중이 신장에 비해 더 많이 나가는지 더 적게 나가는지, 빼빼하게 자라고 있는지, 뚱뚱하게 자라고 있는지, 신장 백분위 수치나 체중 백분위 수치가 50백분위 수치보다 더 큰지 작은지 알아볼 수 있다.
- 태어나서 18세가 될 때까지 소아청소년 나이에 해당하는 신장 치나 체중 치가 서로 만나는 (XY) 좌표 점을 각 아이 성별과 그 아이에 해당되는 성장차트 백분위선에 따라 계속 그려 나가면 그 아이의 신장 백분위수(퍼센타일/Height percentile)와 체중 백분위수(Weight percentile)가 얼마인지 쉽게 찾아볼 수 있다.
- 그 아이의 체중과 신장이 적절히 증가되고 아이가 정상적으로 잘 자라는지 알 수 있다.
- 어떤 아이가 한두 살일 때 성장차트에 있는 체중 백분위선이나 신장 백분위선이나 체중이나 신장 백분위수를 보고 그 아이가 18세가 될 때 체중 치와 신장 치가 얼마나 될지 추정할 수 있다.
- 저자가 소아과 진료생활을 다 마치고 길에서 저자의 소아과 환자였던 부모 한분을 만났다.
- 그 분이 ” 닥터 리. 제가 나의 아들 스카트가 1세 때 닥터 리 소아과에서 소아 건강검진을 받을 때 닥터 리가 내 아들 스카트가 18세가 될 때는 체중이 80kg라 될 것이고 키는 175cm가 될 것이라고 성장차트를 통해 추정했는데, 영락없이 18세 스카트의 체중이 81kg이고 키가 175cm라고 하면서 닥터 리의 말이 꼭 맞았다”라고 인사했다.
- 학교나 병원에서 소아 건강검진을 주기적으로 받을 때 학생의 체중의 백분위수와 신장의 백분위수가 그 동안 자라온 체중 백분위선과 신장 백분위선을 따라 계속 정상적으로 자라고 있는지 기본적으로 알아본다.
- 체중이나 신장이 “평균이다”, “평균 이하이다” 또는 ” 평균 이상이다”, “중간이다”라는 등의 내 자녀의 성장이 어떻게 자라는지 알아보는 대신 자녀의 체중이나 신장이 몇 퍼센타일에 있는지알아본다.
- 자녀들의 나이에 해당되는 체중과 신장의 성장 퍼센타일이 얼마인지 알면 자녀의 신장과 체중의 성장속도를 타각적으로 알 수 있다. 나서부터 18세가 될 때까지 소아청소년 추정 체중 치와 신장치가 얼마나 될 지 알아볼 수 있다.
- 순이는 순이 대로 복남이는 복남이 대로 성장하게 하고 자연적으로 크는 장면을 볼 수 있을 것이다.
|
다음은 “성장 발육, 설사에 대한 질문입니다”에 관한 인터넷 소아청소년 건강상담 질의응답의 예 입니다. |
Q.&A.성장 발육, 설사에 대한 질문입니다
Q.
안녕하세요. 며칠 전 글 남겼던 엄마인데요.
우유 먹으면 설사한다고 했었는데 하루 안 먹였더니 변 한 번 봤다고 했던, 기억나실진 모르겠습니다. 오늘은 더 자세하게 여쭤볼게 있어서 방문을 했습니다.
저희 딸 태어났을 때 3kg이었구요 지금은 14개월인데 10kg입니다.
7개월 때 몸무게가 늘진 않네요 그리고 키는 77cm이구요. 우유를 안 먹이고 요즘엔 그냥 하루에 밥 세 번 중간에 간식이나 과일을 조금씩 먹이는데 또 변을 하루에 3~4번 정도 보네요.
변은 우유 먹을 때보다 묽진 않지만 그래도 횟수가 걱정이에요.
넘 많이 변을 봐서 혹시 애한테 안 좋진 않을까 해서요.
주변에선 괜찮다고 하는데 그리고 이렇게 자주 변을 보는 아이들이 있다고 하는데 정말 그런지 아니면 무슨 검사를 받아 보아야 하는 건지 정말 난감합니다. 변이 나빠 보이지는 않거든요.
혹시나 어디가 나쁠 때 이런 증상이 보이는 건 아닌지 정말 걱정입니다.
(글 보시고 답변 부탁드리겠습니다!)
A.
김서방님
안녕하세요. 또 질문해 주셔 감사합니다.
아이의 나이, 성별, 과거와 가족의 병력, 진찰소견, 임상검사 결과 등 많은 정보가 있으면 더 좋은 답변을 드릴 수 있습니다. 주신 정보를 참작해 답변을 드립니다.
아기가 태어났을 때는 체중이 25퍼센타일 이었고 14개월에는 60 퍼센타일 입니다.
키도 60퍼센타일 입니다.
즉 자녀의 체중은 평균 체중보다 조금 더 나가고 신장도 평균 신장보다 조금 더 큽니다.
출생 시 체중의 퍼센타일에 해당되는 체중의 백분위선을 따라 체중이 계속 증가하는 것이 일반적입니다.
아기의 키는 태어났을 때의 25 백분위선수 이었던 것보다 훨씬 더 나가는 60 백분위수선에 있습니다. 제가 진찰을 하지 않고 성장차트에 의하면 자녀의 체중이 정상적으로 잘 자라고 있습니다.
그리고 체중의 증가도 정상적입니다.
이런 속도로 체중이 계속 증가되면 18세가 될 때 추정 체중은 거의 55kg이 될 것이고 신장은 160cm 됩니다.
대변이 설사 변 같이 묽지 않고, 하루 3번 정도 보는 것은 정상적입니다.
또 흥분성 위장증후군이나 음식물 불내증, 람불편모충증 등으로 인해 대변을 정상 이상으로 많이 볼 수 있습니다.
글루텐 유발 장증(셀이악 병)으로 인한 설사를 할 수 있고
대변의 양이 비정상적으로 많을 수 있습니다.
우유를 마시지는 않지만 우유성분이 든 음식물이 요즘 많이 있습니다.
혹시 그런 음식물을 먹고 설사를 할 수 있고.
하루 여러 번 대변을 볼 수 있습니다.
제 생각으로 체중이 정상적으로 증가하고 대변도 정상적으로 누는 것 같습니다.
CBC 피 검사, 소변검사, 대변 기생충검사, 대변 잠재성 출혈검사(대변 잠혈 검사) 등을 하고 소아과에서 검진을 받고 상담해보시는 것이 좋을 것 같습니다.
그 검사 결과가 모두 정상이면 2~3개월 후에 체중을 다시 재어보시는 것이 좋을 것 같습니다.
우유나 우유 음식물이 부모들의 체질에 맞지 않으면 자녀들에게도 맞지 않을 가능성이 있습니다.
우유 음식물을 끊어 보세요.
하여튼 체중이 정상으로 증가하고 정상적으로 대변을 보면 2~3주 후 우유를 다시 조금씩 먹여보셔도 될 것입니다.
우유 음식물을 필수적으로 꼭 먹을 필요는 없습니다.
[부모도 반의사가 되어야한다]-소아가정간호백과 제 7권 소아청소년 감염병–람불편모충증. 제 9권 소아청소년 소화계 질환 –설사, 유당 불내증, 글루텐 유발성 장증(셀이악 병)으로 인한 설사. 성장차트 등을 참조하시기 바랍니다. 질문이 더 있으면 또 방문하세요.감사합니다. 이상원 드림
그림 5-1. 0-36개월 한국 여아 성장차트(대한소아과학회 1975년도 한국 남아 체중, 신장치를 근거로 1988년도 소아과 전문의 이상원 저)
Copyright ⓒ 2011 John Sangwon Lee, MD, FAAP
그림 5-3. 0-36개월 한국 남아 성장차트(대한소아과학회 1975년도 한국 남아 체중, 신장치를 근거로 1988년도 소아과 전문의 이상원 저)
Copyright ⓒ 2011 John Sangwon Lee, MD., FAAP
그림 5-2. 2-18세 한국 여아 성장차트(대한소아과학회 1975년도 한국 남아 체중, 신장치를 근거로 1988년도 소아과 전문의 이상원 저)
Copyright ⓒ 2011 John Sangwon Lee, MD., FAAP
그림 5-4. 2-18세 한국 남아 성장차트(대한소아과학회 1975년도 한국 남아 체중, 신장치를 근거로 1988년도 소아과 전문의 이상원 저)
Copyright ⓒ 2011 John Sangwon Lee, MD., FAAP
- 건강한 소아청소년(0~18세)들의 체중 치와 신장 치에 해당되는 나이와 만나는 좌표 점을 이어서 만든 차트를 성장차트라고 한다.
소아청소년 성장차트의 종류
- 0~3세 남 신생아들, 영유아들의 체중 성장차트
- 2~18세 남 유아들, 학령기 아이들, 사춘기 아이들의 체중 성장차트
- 0~3세 남 유아들의 신장 성장차트와
- 2~18세 남 유아들, 학령기 아이들, 사춘기 아이들의 신장 성장차트
- 0~3세 여 신생아들, 영유아들의 체중 성장차트와
- 2~18세 여 유아들, 학령기 아이들, 사춘기 아이들의 체중 성자차트
- 0~3세 여 신새아들, 영유아들의 신장 성장차트와
- 2~18세 여 유아들, 학령기 아이들, 사춘기 아이들의 신장 성장차트
- 각 인종 또는 각 나라에 따라 만든 각국 소아청소년 성장차트
- 만삭 신생아로 태어난 만삭 신생아 성장차트와 미숙 신생아 성장차트
- ⑪ 두위 성장차트 등이 있다.
성장차트를 어떻게 만드나
- 소아청소년 체중 성장차트는 소아청소년의 나이(월령 또는 연령) X선과 그 나이에 해당되는 체중 치(단위는 kg 또는 파운드) Y선이 만나는 (XY) 좌표 점을 연결해서 만든 도표이다.
- 여러 종류(①~⑪)의 성장차트가 있다.
- 신장 성장차트는 아이의 나이(월령 또는 연령) X선과 나이에 해당되는 신장 치(단위는 cm 또는 인치) Y선이 만나는(XY) 좌표 점을 연결해서 만든다.
- 거의 마찬가지로, 체중 성장차트는 아이의 나이(월령 또는 연령) X선과 그 나이에 해당되는 체중 치(kg이나 파운드) Y선이 만나는 (XY) 좌표 점을 연결해서 만든다.
- 체중 치에 해당되는 X선이나 신장 치에 해당되는 X선과 그 아이의 연령에 해당되는 연령 Y이 만나는 (XY)점을 성장차트에서 찾아, 각 아이의 성장차트 체중 백분위선에 있는 퍼센타일이 얼마인지 알아보고 또 신장 백분위선에 있는 신장 퍼센타일이 얼마인지 알아볼 수 있다.
- 한 아이의 체중과 신장이 그 아이의 체중 백분위선이나 신장 백분위선을 따라 계속 정상적으로 자라는지 육안으로 직접 보고 타각적으로 평가할 수 있다.
- 성장차트는 소아청소년 남여 성별에 따라, 나이에 따라 생후 0~36개월 영유아 성장차트와 생후 2~18세 유아, 학령기 아이, 사춘기 아이 성장차트가 따로 있다.
- 나이와 성별에 따라 해당 성장차트를 이용해야 한다.
- 다시 설명하면, 소아청소년 나이, 즉 월령, 또는 연령 (X)에 해당되는 체중 치(Y)가 서로 만나는 (XY) 좌표 점을 이어 만든 체중 성장차트와 소아청소년 나이 즉 월령 또는 연령(X)에 해당되는 신장 치가 서로 만나는 (XY) 좌표 점을 이어 만든 신장 성장차트가 따로 있다.
- 성장차트 맨 위 최상 횡선과 맨 아래 바닥 횡선에 있는 숫자는 월령 또는 연령이고, 맨 왼쪽 수직선 숫자와 맨 오른쪽 수직선 숫자는 체중 치 또는 신장 치이다.
- 체중 치 단위는 킬로그램(kg) 또는 파운드(lb)이고 신장 치 단위는 센티미터(cm) 또는 인치(in)이다.
- 성장차트 백분위선 맨 오른쪽에 있는 3, 10, 25, 50, 75, 90, 97의 숫자는 체중 백분위 수치(체중 퍼센타일)나 신장 백분위 수치(신장 퍼센타일)이다.
- 소아청소년들의 신장과 체중은 인종·나라·지방·사회·환경·식생활 등에 따라 다르다.
- 각 아이에 따라 성장차트 체중 백분위선과 신장 백분위선이 다르다.
- 태어나서 2~3세까지 신생아, 영유아 성장 속도는 2~3세부터 18세까지 유아, 학령기 아이, 사춘기 아이의 성장 속도에 비해 다른 점이 많다.
- 0~3세까지 체중 성장차트, 신장 성장차트와 2~18세까지 체중 성장차트, 신장 성장차트가 남녀아 별로 따로 있다.
- 소아청소년 여아 성장 발육과 소아청소년 남아 성장 발육이 많이 다르기 때문에 소아청소년 여아 성장차트와 소아청소년 남아 성장차트가 따로 있다.
- 0~3세 신생아 영유아들의 체중 성장차트와 신장 성장차트,
- 2~18세 유아, 학령기 아이, 사춘기 여아 체중 성장차트와 신장 성장차트,
- 0~3세 신생아, 영유아 체중 성장차트와 신장 성장차트,
- 2~18세 유아, 학령기 아이, 사춘기 남아 체중 성장차트와 신장 성장차트 등 총 여덟 가지의 기본 소아청소년 성장차트가 있다.
- 성장차트로 소아청소년의 체중과 신장의 성장 상태와 성장 패턴을 일목요연하게 쉽게 알아볼 수 있다.
- 여기에 있는 한국 남녀 소아청소년 성장차트는 1975년에 한국 소아과학회에서 수집한 한국 소아청소년 체중 치과 신장 치의 통계 자료를 이용해 저자가 만들어 1988년도 소아가정의학백과에 섰다.
- 자녀들의 나이에 해당되는 체중과 신장 퍼센타일과 성장 퍼센타일이 얼마인지 알면 자녀의 신장과 체중의 성장 속도를 알 수 있고, 나서부터 18세가 될 때까지 추정 체중 치과 신장 치를 얼마나 될 것인지 알아볼 수 있다.
Growth charts and growth percentiles of 0-18-year-old Korean children and adolescents
- Figure 5-1. Growth chart for Korean girls 0-36 months (based on Korean boy weight and height values in 1975 by the Korean Academy of Pediatrics, by pediatrician Lee Sang-won in 1988) Copyright ⓒ 2011 John Sangwon Lee, MD, FAAP
- Figure 5-3. Growth chart for Korean boys 0-36 months (author Lee Sang-won, pediatrician, 1988 based on Korean boy weight and height values in 1975 by the Korean Academy of Pediatrics) Copyright ⓒ 2011 John Sangwon Lee, MD., FAAP
- Figure 5-2. Growth chart for Korean girls aged 2–18 years (based on Korean boy weight and height values in 1975 by the Korean Academy of Pediatrics, by pediatrician Lee Sang-won in 1988) Copyright ⓒ 2011 John Sangwon Lee, MD., FAAP
- Figure 5-4. Growth chart for Korean boys aged 2–18 years (based on Korean boy weight and height in 1975 by the Korean Academy of Pediatrics, by pediatrician Lee Sang-won in 1988) Copyright ⓒ 2011 John Sangwon Lee, MD., FAAP
- • A chart created by connecting the coordinate points that meet the age corresponding to the weight and height values of healthy children and adolescents (0~18 years old) is called a growth chart.
Types of growth charts for children and adolescents
- 1. Weight growth chart of 0~3 year old male newborns and infants
- 2. Weight growth chart for boys aged 2-18 years, school-age children, and adolescent children
- 3. Height growth chart of 0~3 year old male infants and
- 4. Height growth chart for boys aged 2-18 years, school-age children, and adolescent children
- 5. Weight growth chart of 0~3 year old female newborns and infants
- 6. Weight and gender charts for girls aged 2 to 18, school-age children, and adolescents
- 7. The height growth chart of 0~3 year old females and infants
- 8. Height growth chart of 2~18 year old female infants, school-age children, and adolescent children
- 9. Growth charts for children and adolescents in each country or country
- 10. Full-term newborn growth chart and premature newborn growth chart
- 11.⑪ There are head-to-head growth charts, etc.
How to make a growth chart
- The weight growth chart for children and adolescents is a chart created by connecting the (XY) coordinate points where the X-ray of the age (month or age) of children and adolescents and the corresponding weight value (unit: kg or pound) Y-line meet.
- • There are several types of growth charts (①~⑪). The height growth chart is created by connecting the (XY) coordinate point where the X-ray of the child’s age (month or age) and the height (unit: cm or inch) Y-line corresponding to the age meet.
- • Much likewise, a weight growth chart is created by connecting the (XY) coordinate points where the X-ray of the child’s age (months or age) meets the Y-ray of the child’s weight (kg or pounds) corresponding to that age.
- • Find the (XY) point where the X-ray corresponding to the weight value or the X-ray corresponding to the height value and the age Y corresponding to the child’s age meet in the growth chart, You can find out what your height is and find out what your height percentile is in your height percentile.
- • You can visually evaluate whether a child’s weight and height continue to grow normally along the child’s weight percentile or height percentile, visually and objectively. • There are separate growth charts for children aged 0 to 36 months, and growth charts for children aged 2 to 18 years old, school-age children, and adolescents, depending on gender and age.
- • You should use the corresponding growth chart according to your age and gender.
- • In other words, the weight growth chart created by connecting (XY) coordinate points where the weight values (Y) corresponding to the age (month) or age (X) meet each other and the age of children and adolescents, i.e. month age or age (X) There is a separate height growth chart made by connecting the (XY) coordinate points where the height values corresponding to each meet.
- • The numbers in the top and bottom horizontal lines of the growth chart are the age or age, and the numbers in the leftmost and rightmost vertical lines are weight or height.
- • Units of weight are kilograms (kg) or pounds (lb) and units of height are centimeters (cm) or inches (in).
- • The numbers 3, 10, 25, 50, 75, 90, and 97 on the far right of the percentile line on the growth chart are weight percentiles (weight percentiles) or height percentile numbers (height percentiles).
- • The height and weight of children and adolescents differ according to race, country, region, society, environment, and diet.
- • Each child has different growth chart weight percentiles and height percentiles.
- • The growth rate of newborns and infants from birth to 2-3 years of age is different from that of infants, school-age children, and adolescents aged 2-3 to 18 years.
- • There are separate weight growth charts and height growth charts for 0-3 years old and weight growth charts and height growth charts for 2-18 years old for boys and girls. • Because the growth and development of children and adolescents is very different from the growth and development of children and adolescents, there are separate growth charts for children and adolescents and boys.
- • Weight growth chart and height growth chart for infants and toddlers aged 0 to 3 years old, • Weight growth chart and height growth chart for infants 2-18 years old, school-age children, adolescent girls,
- • 0~3 years old newborn, infant weight growth chart and height growth chart,
- • There are a total of eight basic growth charts for children and adolescents, including weight growth charts and height growth charts for children aged 2 to 18 years old, school-age children, and adolescent boys.
- • The growth chart makes it easy to understand the growth status and growth patterns of children and adolescents’ weight and height. • The Korean male and female pediatric and adolescent growth charts were created by the author using statistical data of Korean pediatric weight and dental heights collected by the Korean Academy of Pediatrics in 1975 and published in the Encyclopedia of Pediatrics and Family Medicine in 1988.
- • Knowing the weight and height percentages and growth percentages for your child’s age gives you an estimate of how tall and weight your child will grow, and what your estimated weight will be by the time you are 18 years old.
How to use growth charts
• Accurately measure the height values of children and adolescents, and draw the weight values and height values on the corresponding XY coordinates of the growth chart to objectively check the growth status of children and adolescents.
• If possible, take off your outerwear and measure your weight and height while wearing underwear or panties and gowns.
• If it is a boy, select the growth chart corresponding to the boy’s age, if the age is 3 years or less, select the 0~3 year old boy growth chart,
• Find the height coordinate point (XY) and weight coordinate point (XY) where the vertical line (Y) corresponding to the child’s age and the horizontal line (X) corresponding to the height or weight meet each other. When comparing the growth chart made based on the weight and height of children and adolescents with the growth chart here, it can be seen that the weight and height of Korean adolescents are larger.)
• The growth chart percentile corresponding to each coordinate point (XY) becomes the height percentile or weight percentile of each child.
• If you compare each child’s height and weight percentile values found in this way, you can see whether each child weighs more or less for their height, whether they are overweight or obese, and their height or weight percentile. You can determine whether is greater or less than the 50th percentile.
• From birth until the age of 18, if the (XY) coordinate points where the height and weight values corresponding to the age of children and adolescents meet each other are continuously drawn along the growth chart percentile line corresponding to each child’s gender and that child, the child’s height percentile ( You can easily find out what the percentile/height percentile and weight percentile are.
• Know that the child is gaining adequate weight and height and that the child is growing normally.
• When a child is one or two years old, by looking at the weight percentile or height percentile or weight or height percentile on a growth chart, you can estimate how much weight and height the child will have when he or she turns 18.
• After the author had completed his pediatric treatment, he met one of his parents, who was a pediatric patient on the road. • He said, “Dr. Lee. When I went to Dr. Lee’s Pediatric Clinic when my son Scott was 1 year old, Dr. Lee made a growth chart that said that when my son Scott turns 18, he will weigh 80 kg and will be 175 cm tall. I estimated through it, but Dr. Lee was right, saying that the 18-year-old Scott weighed 81 kg and was 175 cm tall.”
• When receiving regular health checkups for children at school or hospital, check whether the student’s weight percentile and height percentile continue to grow normally along the weight percentile and height percentile.
• What percentage of my child’s weight or height is instead of “average”, “below average” or “above average” or “medium” how my child’s growth is growing? Find out
• If you know what the weight and height growth percentiles are for your children’s age, you can objectively know the growth rate of your children’s height and weight. From then until the age of 18, you can find out what the estimated weight and height of children and adolescents will be.
• As Soon-i does, Bok-nam lets Bok-nam grow as Soon-yi does, and you will be able to see the scene where he grows naturally.
The following is an example of a Q&A for health counseling for children and adolescents on the Internet about “A question about growth and development and diarrhea”.
Q.&A.
A question about growth and development, diarrhea
Q. Hello. It’s the mom I wrote a few days ago. She said that if she ate milk, she said she had diarrhea, but she said she hadn’t eaten in a day and she said she had one poop, I don’t know if she remembers. She made a visit today because I would like to ask you in more detail. When our daughter was born she weighed 3 kg and she is now 14 months and weighs 10 kg. When she is 7 months she does not gain weight and she is 77 cm tall. I don’t drink milk and these days I just eat a little snack or fruit between meals three times a day, but I also have a bowel movement 3-4 times a day. My stool is not as watery as when I drink milk, but I’m still worried about the number of times. I had too many poops, so I was wondering if it would be bad for the child. People around me say it’s okay, and there are children who have a bowel movement like this, but it’s really hard to know if it’s really the case or what kind of test to get. The stool doesn’t look bad. I’m really worried if I’m seeing these symptoms when something goes wrong.
(Please read the article and reply!) A. Seobang Kim Hello. Thank you again for asking. We can give you a better answer if you have a lot of information such as the child’s age, sex, past and family history, examination findings, and clinical test results. We will respond based on the information you have provided. When the baby was born, her weight was 25 percent and at 14 months she weighed 60 percent. Her height is also 60 percentile. This means that your child weighs a little more than average weight and is also a little taller than average height. It is common to continue to gain weight along a percentile of body weight that is a percentage of birth weight.
Your baby’s height is at the 60th percentile, which is much higher than it was at the 25th percentile at birth. According to the growth chart without my examination, the child’s weight is growing normally. And weight gain is also normal. If you continue to gain weight at this rate, your estimated weight will be nearly 55 kg by the age of 18, and you will be 160 cm tall. It is normal to have stools that are not watery like diarrheal stools, and to pass up to 3 times a day.
In addition, excitatory gastrointestinal syndrome, food intolerance, trichomonas parasites, etc. can cause more stool than normal. Diarrhea due to gluten-induced enteropathy (Celiac disease)
The amount of stool may be unusually large. I don’t drink milk, but there are a lot of foods containing milk these days. If you eat such food, you may have diarrhea. You may have a bowel movement several times a day. My guess is that I gain normal weight and have a normal stool. CBC blood test, urine test, fecal parasite test, fecal latent blood test (fecal occult blood test), etc. If the test results are all normal, it would be better to weigh yourself again after 2-3 months. If milk or milk food does not suit the parents’ constitution, there is a possibility that it may not be suitable for the children either.
Stop milking food. In any case, if you gain normal weight and have a normal bowel movement, you may want to start feeding the milk little by little after 2-3 weeks. You don’t necessarily have to eat milk food.www.drleepediatrics.com – Encyclopedia of Pediatric and Family Nursing, Vol. 7 Infectious Diseases in Children and Adolescents – Trichomoniasis. Book 9 Digestive System Disorders in Children and Adolescents -Diarrhea, lactose intolerance, and diarrhea caused by gluten-induced enteropathy (Celliac disease). Please refer to the growth chart, etc. Please visit again if you have more questions. Thank you. Lee Sang-won Dream
출처 및 참조 문헌 Sources and references
- NelsonTextbook of Pediatrics 22ND Ed
- The Harriet Lane Handbook 22ND Ed
- Growth and development of the children
- Red Book 32nd Ed 2021-2024
- Neonatal Resuscitation, American Academy Pediatrics
-
소아가정간호백과–부모도 반의사가 되어야 한다, 이상원
-
Nelson Textbook of Pediatrics 14th ed. Beherman,
-
The Johns Hopkins Hospital, The Harriet Lane Handbook, 18th edition
-
Red book 29th edition 2012
-
Nelson Text Book of Pediatrics 19th Edition
-
Infectious disease of children, Saul Krugman, Samuel L Katz, Ann A. Gerhon, Catherine Wilfert
-
The Harriet Lane Handbook 19th Edition
-
제14권 소아청소년 내분비․유전․염색체․대사․휘귀병 참조문헌 및 출처
-
Sources and references on Growth, Development, Cares and Diseases of Newborn Infants
-
Emergency Medical Service for Children, By Ross Lab. May 1989. p.10
-
Emergency care, Harvey grant and Robert Murray
-
Emergency Care Transportation of Sick and Injured American Academy of Orthopaedic Surgeons
-
Emergency Pediatrics A Guide to Ambulatory Care, Roger M. Barkin, Peter Rosen
-
Endocrine and Genetic Diseases of Childhood and Adolescence, Lytt I Gardner, M.D., W.B. Saunders
-
Recognizable Patterns of Human Malformation, Smith
-
Diagnosis in color Pediatrics, Taylor Raffles
-
Atlas of PEDIATRIC PHYSICAL DIAGNOSIS, Frank A. Oski
-
Growth and Development of Children, George H. Lowrey 8th ed
-
소아과학 대한교과서
-
의학 용어사전 대한 의사 협회
-
그 외
Copyright ⓒ 2014 John Sangwon Lee, MD, FAAP
“부모도 반의사가 되어야 한다”-내용은 여러분들의 의사로부터 얻은 정보와 진료를 대신할 수 없습니다.
“The information contained in this publication should not be used as a substitute for the medical care and advice of your doctor. There may be variations in treatment that your doctor may recommend based on individual facts and circumstances.
“Parental education is the best medicine.